My last post touched on further development of model audit scripts with Dynamo.
There was a desire to capture all of the valuable data collected as part of the audit, just running the audit as an issued state check is very useful but once the Excel spreadsheet used to present and record the results is closed all of the data is lost, furthermore there is additional data in the model which would be useful to capture.
For example, consider comparing the data for the number of sheets in a model, a fairly broad measure of project complexity and the data showing hours worked from a company time-sheet database. This would allow for more accurate costing on similar future projects. There are countless similar metrics and with the advent of machine learning upon us capturing vast amounts of data now has never been more important. We don't yet know what uses there will be for this in years to come.
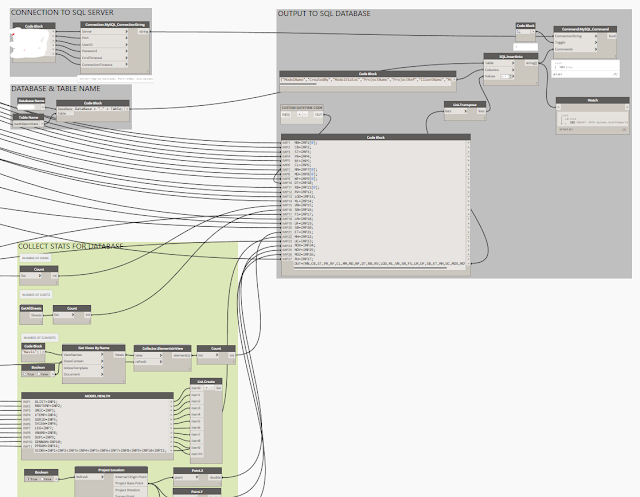
In order to record the data it's necessary to connect dynamo to a database, Dynamo has no internal methods of recording data and following a few experiments with mySQL Lite I opted for a mySQL database setup. The additional script needed to export the data to SQL is fairly simple, thanks to the Slingshot custom nodes no additional Python scripts are required.
The script was laid out neatly with code blocks to allow for future scaling should it be necessar to capture more data as the audit expands.
Once the updated audit was network deployed, all audits run from Dynamo would export the results to the SQL database in the final step of the script.
A native SQL database is not the most user friendly interface, so to work with and present the data i choose to use PowerBI by Microsoft. The dynamic user interface is very user friendly and results look great, you can hover over bars of data to get properties and drill down into the data on the fly to create whole new charts. Find out more here https://powerbi.microsoft.com/en-us/.
I won't go into too much detail on the process of creating the charts etc here, but it's very easy to use and writing queries is incredibly simple. These are some examples of how i am analysing the data, the reports will display live model status data via a web browser.
For example, consider comparing the data for the number of sheets in a model, a fairly broad measure of project complexity and the data showing hours worked from a company time-sheet database. This would allow for more accurate costing on similar future projects. There are countless similar metrics and with the advent of machine learning upon us capturing vast amounts of data now has never been more important. We don't yet know what uses there will be for this in years to come.
In order to record the data it's necessary to connect dynamo to a database, Dynamo has no internal methods of recording data and following a few experiments with mySQL Lite I opted for a mySQL database setup. The additional script needed to export the data to SQL is fairly simple, thanks to the Slingshot custom nodes no additional Python scripts are required.
The script was laid out neatly with code blocks to allow for future scaling should it be necessar to capture more data as the audit expands.
Once the updated audit was network deployed, all audits run from Dynamo would export the results to the SQL database in the final step of the script.
I won't go into too much detail on the process of creating the charts etc here, but it's very easy to use and writing queries is incredibly simple. These are some examples of how i am analysing the data, the reports will display live model status data via a web browser.


Great article. but without sharing the dataset, its hard to implement, Please provide.
ReplyDeleteThis is super useful, unfortunately I'm not working with dynamo yet, I have only just scratched the surface, but I do these checks manually at the moment. I would really like to get a hand on this script. would that be possible somehow??
ReplyDeletewhat does dynamo cost?
ReplyDelete